Divers
Entreprise Vault
Déplacer une partition sur le même serveur
Problème
Vault est une vrai bénédiction pour les admins, jusqu'a ce que les disques (ou partitions) soient eux aussi saturés...
Avant qu'il ne soit trop tard, il convient de faire un peut de ménage, en déplacant l'une ou l'autre ancienne partition vers des disques plus lents ou moins couteux... Mais sur le même serveur.
Solution
Bien qu'il n'existe aucun "wizard" pour ce faire, ce type de migration de données est assez facile, car contrairement aux fichiers utilisateurs, vous avez un controle total sur le serveur.
-
Placer le serveur Vault en mode "Backup" (AKA read-only);
-
Redémarrer les services VAULT.
-
Faite un bon backup complet (on ne sait jamais...)
-
Vérifiez la table "Watchfile" en utilisant le "SQL Server Enterprise Manager (SQL 2000)" ou "SQL Server Management Studio (SQL 2005)", si vous avez trop de données suivez ce technote http://www.symantec.com/docs/TECH68204 pour "nettoyer".
- Copiez la partition "Vault" vers sa nouvelle location, si il s'agit d'une partition "fermée" vous pouvez faire cette opperation en premier puisque la partition ne sera pas modifiée et conserver le serveur "actif" le plus longtemps possible...
- Stopez tout les service Enterprise Vault..
- Re ouvrez le "SQL Server Enterprise Manager (SQL 2000)" ou "SQL Server Management Studio (SQL 2005)"
- Navigez dans Databases | EnterpriseVaultDirectory | Tables
- Ouvrez la table VaultStoreEntry et lister toutes les lignes...
Note: Le VaultStoreEntryId correspond a un VaultStoreName. Notez scrupuleusement l'ID (Figure1) et refermez la table.
Figure 1

- Ouvrez la table PartitionEntry et lister toutes les lignes... cherchez le bon VaultStoreEntryI
Note: le VaultStoreEntryId correspond a un PartitionRootPath. Il vous suffit de modifier le chemin de cette colonne vers le nouveau chemin de la partition (Figure 2)
Figure 2

- Executez la requete une fois de plus pour vous assurez du changement.
- Remettre le Serveur en mode Read/Write; désactivez le mode backup.
- Re-démarrez les services Vault.
- Vérifiez scrupuleusement les logs d'applications et le bon fonctionnement du Vault.
- Après quelques test concluants, vous pouvez détruire l'ancienne partition.
Modifié AEVA gallerie pour loggué tout
Ayant eut quelques visiteurs indélicats sur ma gallerie, j'ai décidé de mettre en oeuvre une sorte de logs; j'ai aussi écrit un outils qui permet d'avoir une vue sur les x derniers accès, avec géolocalisation; je ferais sans doute un article plus complet sur cet outils plus tard.
AEVA est sans doute l'une des gallerie les plus performantes que j'ai eut a installer; mais elle ne reseigne que le nombre de 'vues' sur une image/video, en aucun cas, la localisation du visiteur; de mon point de vue, plus on en sait; mieux c'est; j'ai donc modifié aeva gallerie pour que celui-ci loggue chaque demande dans une table...
voici le "how-to" (pour une version 1.4c)
commençons par la table qui va contenir le log:
CREATE TABLE IF NOT EXISTS `media_log_visit`(
`stamp` int(11) NOT NULL,
`IP` varchar(16) character set latin1 collate latin1_german1_ci NOT NULL,
`id` int(11) NOT NULL,
`referer` varchar(1024) collate latin1_general_ci default NULL,
`useragent` varchar(1024) collate latin1_general_ci default NULL,
KEY `stamp` (`stamp`),
KEY `IP` (`IP`),
KEY `id` (`id`),
KEY `referer` (`referer`(1000)),
KEY `useragent` (`useragent`(1000))
) ENGINE=MyISAM DEFAULT CHARSET=latin1 COLLATE=latin1_general_ci;
Ensuite nous modifions les fichiers:
MGalleryItem.php
ligne 36:
$id = isset($_REQUEST['id']) ? (int) $_REQUEST['id'] : (int) $_REQUEST['in'];
$type = isset($_REQUEST['thumb']) ? 'thumb' : (isset($_REQUEST['preview']) ? 'preview' : 'main');
Insérez juste avant if (!aeva_allowedTo('access'))"
// Fixed by Frater
$amFunc['db_query']('
UPDATE {db_prefix}aeva_media
SET views = views + 1
WHERE id_media = {int:media}',
array('media' => $id),__FILE__,__LINE__);
/* IP Logs by Frater */
$ip = "UNKNOWN";
if ($_SERVER["HTTP_CLIENT_IP"]) $ip = $_SERVER["HTTP_CLIENT_IP"];
if ($_SERVER["HTTP_X_FORWARDED_FOR"]) $ip = $_SERVER["HTTP_X_FORWARDED_FOR"];
if ($_SERVER["REMOTE_ADDR"]) $ip = $_SERVER["REMOTE_ADDR"];
$referer = $_SERVER['HTTP_REFERER'];
$useragent = $_SERVER['HTTP_USER_AGENT'];
$log_date = time();
$query_sql = "INSERT INTO {db_prefix}log_visit
(stamp,IP,id,referer,useragent)
VALUES ($log_date,'$ip',$id,'$referer','$useragent')";
$amFunc['db_query']($query_sql,
array('id' => $id),__FILE__,__LINE__);
// Nothing more to come
en ligne 93; supprimé le block:
$amFunc['db_query']('
UPDATE {db_prefix}aeva_media
SET views = views + 1
WHERE id_media = {int:media}',
array('media' => $id),__FILE__,__LINE__);
// Nothing more to come
Aeva-Gallery.php
autour de la ligne 2190; rechercher:
die('Hacking attempt...');
$type = current(array_intersect(array('thumb', 'thumba', 'preview', 'icon', 'bigicon', 'main'), array_keys($_REQUEST)));
$type = $type === false ? 'main' : $type;
// Get the file's data
$id = (int) $_REQUEST['in'];
/* IP Logs by Frater */
$ip = "UNKNOWN";
if ($_SERVER["HTTP_CLIENT_IP"]) $ip = $_SERVER["HTTP_CLIENT_IP"];
if ($_SERVER["HTTP_X_FORWARDED_FOR"]) $ip = $_SERVER["HTTP_X_FORWARDED_FOR"];
if ($_SERVER["REMOTE_ADDR"]) $ip = $_SERVER["REMOTE_ADDR"];
$referer = $_SERVER['HTTP_REFERER'];
$useragent = $_SERVER['HTTP_USER_AGENT'];
$log_date = time();
$query_sql = "INSERT INTO {db_prefix}log_visit
(stamp,IP,id,referer,useragent)
VALUES ($log_date,'$ip',$id,'$referer','$useragent')";
$amFunc['db_query']($query_sql,
array('id' => $id),__FILE__,__LINE__);
/* IP Logs by Frater */
// Nothing more to come
Voilà c'est fait
Outlook et ses polices
Vous avez Outlook 2003?
Vous désirez y déployer une police particulière sur des dizaines de PC?
facile:
sur un outlook vous configuré les polices suivant votre envie...
vous lancez regedit, naviguez jusqu'a la clé suivante:
HKEY_CURRENT_USER\Software\Microsoft\Office\11.0\Common\MailSettings
vous extrayez les trois clés binaires suivantes:
ComposeFontSimple
ReplyFontSimple
TextFontSimple
Vers un fichier font_outlook.reg
Ensuite sur chaque PC il vous suffit d'excuter la commande suivante:
regedit /s fichiers.reg
Quicktime et Real-player
j'en ai eut marre...
Marre de REALplayer et de sa pub qui s'affiche partout, ...
Marre de Quicktime et de ses saloperies de Itunes qui sont "obligatoire" sans obligation d'achat mais qui pourrissent votre PC...
Marre de regarder un quicktime via une interface bof...
Une bonne solution:
les versions 'alternative'...
Quicktime Alternative et Real Alternative...
http://www.clubic.com/lancer-le-telechargement-18506-0-quicktime-alternative.html
http://www.clubic.com/lancer-le-telechargement-35320-0-real-alternative.html
Note:
quand j'ai écris cette note, je ne connaissait pas VLC... maintenant je suis devenu fan...
il existe aussi VLC (http://www.videolan.com) qui est tres bien...
IWSS (Interscan Web Security Suite 5.5) Virtual Appliance...
...
ISMPeek
Usage: ismpeek.sh [-h] [-F] [-c count] [-m count] [-n period] [-d display_format] [-w filename]
display format used is "Drnysucaz"
Options:
-h Print this help page
-F Display metrics for FTP (by default, HTTP metrics are displayed)
-c Display the column headers every [count] iterations. Default is to display column
headers only on the first iteration
-m Exit ismpeek after [count] iterations. Default is to run until manually interrupted.
-n A new line is printed every [period] seconds, or 5 seconds by default
-w Save output to [filename] instead of stdout
-d Change the columns printed by using any combination of characters [DrRnNyYlLbBsSeEuUzZwWxXtcaCqg]
D DATETIMESTAMP - the time at which this line was output
R REQ_C - the cumulative average of total time IWSS spent handling each transaction, in ms
r REQ_A - the average of total transaction handling time for the last [period], in ms
N DNS_C - the cumulative average time spent on each DNS lookup prior to connecting, in ms
n DNS_A - the average DNS lookup time for the last [period], in ms
Y CON_C - the cumulative average time spent on establishing tcp connections, in ms
y CON_A - the average tcp connection time for the last [period], in ms
L LDAP_C - the cumulative average time spent per LDAP query, in ms
l LDAP_A - the average LDAP query time for the last [period], in ms
B PRE_C - the cumulative average time spent in each pre-scan job, including URL filtering lookup, in ms
b PRE_A - the average pre-scan time for the last [period], in ms
S SCAN_C - the cumulative average time spent in each scan job, including VSAPI and AAXS
s SCAN_A - the average scan job time for the last [period], in ms
E POST_C - the cumulative average time spent in post-scan accounting, in ms
e POST_A - the average post-scan job time for the last [period], in ms
U RATE_C - the cumulative average time spent handling URL rating requests to the remote rating server, in ms
u RATE_A - the average URL rating request time for the last [period], in ms
Z WT/NS/SY/LD/RT/SC% - The percentage of total cumulative request time spent in the activities of
Waiting for network IO(WT), DNS lookup (NS), tcp connecting (SY), LDAP lookup (LD), URL rating (RT), and scanning (SC)
z WT/NS/SY/LD/RT/SC% - The percentage of time spent in io wait, DNS, tcp connect, LDAP, URL rating, and scanning for the last [period]
W NB/DK/BL/NS/ES% - The percentage of total cumulative time spent in nonblocking IO, disk IO,
blocking IO (ldap, access quota), normal scan, and expensive scan stages
w NB/DK/BL/NS/ES% - The percentage of time spent in nonblocking IO, disk IO,
blocking IO (ldap, access quota), normal scan, and expensive scan stages for the last [period]
X TX_TOTAL_C TX_BLOCK_C - The cumulative number of transactions handled and blocked, respectively
x TX_TOTAL_A TX_BLOCK_A - The number of handled and blocked transaction during the last [period]
t THRU_IN - the throughput received from servers for the last measured interval, in bytes per second.
THRU_OUT - the throughput received from clients for the last measured interval, in bytes per second
Throughput is calculated over 5 second intervals, regardless of the [period] setting.
If [period] is not a multiple of 5, then THRU_IN and THRU_OUT will sometimes be
reported as 0, because the latest throughput calculation interval has not yet elapsed
c CONNS - the number of clients currently connected to the proxy
a ACTIVE - the number of sessions connected to the client that are at least partly through
a transaction, and not merely waiting for a follow-on client request to arrive on a keep-alive
connection
C {CLI,SRV,PXY,TMO}_CLOSE - the number of sessions closed by action from the client, server, proxy, or timeout
q LSTNQ - the number of newly established sessions waiting to be handled by any thread
NBIOQ - the number of sessions waiting for a non-blocking IO stage thread to handle them after
returning from any other stage
DIOQ - the number of sessions waiting to be handled by a disk IO stage thread
BIOQ - the number of sessions waiting to be handled by a blocking IO (ldap, access quota, user-id) stage thread
NSCNQ - the number of sessions waiting to be handled by a normal scanning stage thread
ESCNQ - the number of sessions waiting to be handled by an expensive scanning stage thread
ACCTQ - the number of objects waiting to be processed by an accounting stage thread
g AL/BL/VL/AQ - the number of pending logs dropped due to event generation speed
exceeding logging/database update speed. AL = access, BL = URL or WRS block,
VL = virus log, AQ = access quota consumption update
k RSKA - the current number of idle keep-alive rating server sockets
IWSS - current transaction
Pour voir les transaction en cours par le systeme:
Rendez vous dans le dossier de iwss, vous y trouverez une commande stpeek... qui permet de voir les transaction en cours...
Prints, in tab separated format, the status of each proxied
transaction that is actively handled by IWSS ftp or http proxy
New sessions that are queued will not be displayed
Options:
'F' - print session table for the FTP proxy process
'x' - Don't copy the session table shared memory to process local memory before printing - NOT RECOMMENDED
'h' - Print this informational page
'm' - Print the session table a maximum of [count] times, every [period] seconds.
Default is to print only print the table once. To change [period] use the 'n' option
'n' - Specify the [period] of seconds to peek at the session table. Default is 5 seconds
'w' - Print session table output to the file specified in [filename] instead of to the console
Columns printed:
SEQ:PID or CPID:PPID - The sequence number and process number of the state object attached to
this session. For process-per-session mode daemons this is replaced by the child process
and parent process pids
STATUS - The current status of the transaction. Supported values include:
DISCON - Not connected. These nodes are normally never displayed
RCV_REQ - Waiting for incoming client HTTP or ICAP request
DNS - Resolving the domain name of the HTTP server
CON_SRV - Connecting to the HTTP server
SND_REQ - Relaying the complete client request to the HTTP server
PRL_REQ - Relaying the client request to the HTTP server before
the request has been completely received by IWSS
RCV_RSP - Receiving the HTTP response from the server
SND_RSP - Relaying the complete HTTP or ICAP response from the server to the client
PRL_RSP - Relaying the partial HTTP response from the server to the client
before the entire response has been received by IWSS
SND_100 - Sending a 100 Continue HTTP or ICAP response to the client
TUNNEL - The session is an unexamined HTTPS or non-HTTP protocol transaction
which is tunneled by IWSS
FTPHTTP - An FTP over HTTP transaction
TXDONE - Transaction is complete but not yet reset
PRL_ICAP - Sending an ICAP response before the complete ICAP request has been
received by IWSS
FTP_CMD - Handling the command channel for an FTP session
CON_CMD - Connecting the command channel to the FTP server - includes DNS
DC_SRV - Connecting the passive-mde data channel to the FTP server
DC_CLT - Connecting the active-mode data channel to the FTP client
DL_SRV - Waiting for an active-node data connection from the FTP server
DL_CLT - Waiting for the passive-mode data connection from the FTP client
FTP_UL - Performing an FTP upload
FTP_DL - Performing an FTP download
PS_TXLOG - Writing the transaction log
PS_AQINF - Preparing access quota info
PS_AQENF - Enforcing the access quota
PS_URLS - Checking URL lists
PS_RATE - Performing TMUFE/WRS score query
PS_PLUGIN - Running PreScan plugins
PS_SKIP - Checking skip-scan rules
SC_VIRUS - Performing virus/spyware scan
SC_AAXS - Performing AAXS scan
SC_ITL - Perfoming IntelliTunnel scan
C_SOCK - Descriptor number of the client socket
CLIENT_ADDR - IPv4 address of the client connection
S_SOCK - Descriptor number of the server socket. For FTP proxy this is only the
command channel. For ICAP this is unused.
SERVER_ADDR - IPv4 address of the server connection. For FTP proxy this is
only the command channel. For ICAP this is unused.
LCL_PORT - The local port number used for the server connection
STAGE - The current stage handling the session. This is only used in WorkQueue
daemons, designated by command line option -m for the proxy process
STGTIME - The number of seconds the session has been in the current stage.
This is only used in WorkQueue daemons, designated by command line option
-m for the proxy process
CONTIME - The number of seconds that this client session has been actively handled
IOWAIT - The number of milliseconds since the last I/O event related to this session was handled
THRUBYTE - The number of bytes written to any socket during this transaction
THRUPUT - The number of bytes per second written during the current transaction
FLAGS - Flags set for this session. Currently supported flags:
IDL - The session is idle, waiting for a client request
SSL - The session is HTTPS
SKP - Scanning of this transaction has been skipped due to configuration
TBP - The session is non-HTTP binary protocol tunneled over port 80
AGC - Apollo Guidance Computer
Bonjour,
Actualité (passée) oblige, tous le monde, y va de son petit truc sur l’exploit d’Apollo 11.
Personnelement, je trouve cette partie de l’Histoire de l’humanité particulièrement existante et intéressante, et de mon point de vue de petit humain,un évement sans précédent dans TOUTE l'histoire de l'Humanité.
En tant que professionnel, je ne peux que resté impressionner par la dimension de l'exploit, alors que les hommes de la NASA n'avaient RIEN pour se baser.
Il ne faut surtout pas oublié que durant les années 1960s, un ordinateur, ca ressemblait surtout à ca:
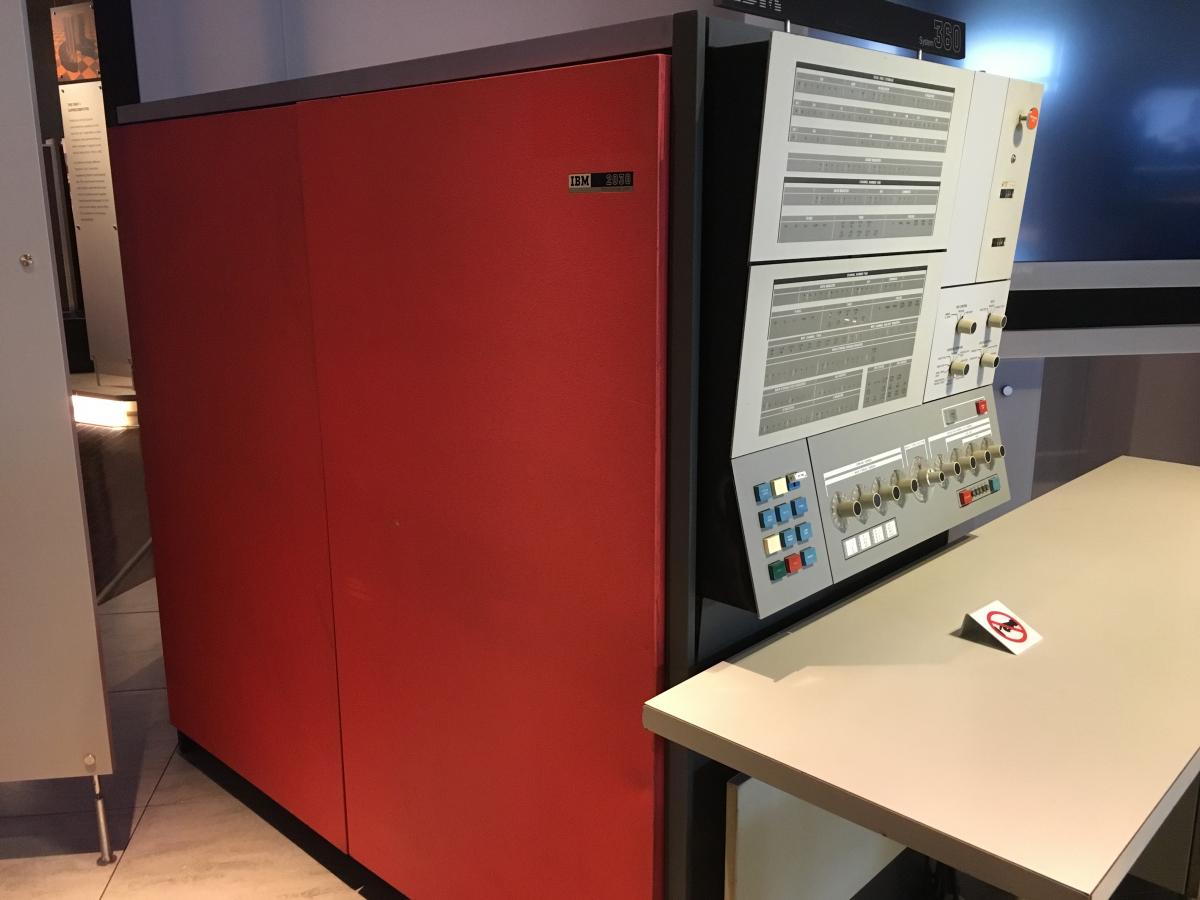 Je vous présent l'ordinateur phare d'IBM dans les années 1960s, la Série IBM 360 Modèle 30, Série concu au début de la décénie, et mise sur le marché en 1964.
A sa sortie, le modèle 30 pesait seulement 770kg, Il a eut deux grands frères plus puissant, les modèles 40 et 50 pesant respectivement 1 tonne et 3,2 tonnes), d’autres modèles (les modèles 60, 70, 90) ont fait partie du catalogue, mais n’ont jamais été construit car jamais commandés.
En 1969, le modèle le plus puissant disponible chez IBM etait le 360 modèle 85, sorti en janvier 1968, il affichait un poids de 6,5 tonnes pour le processeur uniquement.
Impossible d’aller sur la lune avec un tel monstre a bord, et surtout lorsque l'on connait la fiabilité et la consomation de ce genre de bestiaux.
Les gars de la NASA ont dû innover (comme dans beaucoup de partie du programme d’ailleurs).
et de cet inovation est né l'AGC [Apollo Guidance Computer]; des dérivés trsè simplifiés de l'AGC ont équipés les missiles intercontientale américain jusqu'au début des années 1990s.
L'AGC etait tellement en avance sur son temps (logique transistor) que beaucoup de concepteurs (dont un certain Steve Wozniak) peuvent prétendre être les héritiers, notament pour l'usage intensif des transistor et des circuits intégrés.
Aujourd’hui, je trouve dommage que l'AGC ne soit pas étudier dans les écoles, tellement c'est un ordinateur moderne par bien des aspects, mais qui par d'autres aspects est une superbe usine a gaz.
Par bien des aspects, l'AGC est sans doute le premier micro ordinateur qui a (réelement) permis de voyager au delà des frontières connues.
Quand on regarde les spécifications de l’AGC, hummm ca sent tellement bon les années 60 :
|
CPU |
15 bits |
|
RAM |
2048 mots (de 15 bits) |
|
ROM |
36864 mots (avec switch de banque mémoire) |
|
Poids |
32 Kg |
Il existe une vidéo sur Youtube qui explique bien cet ordinateur, et qui démontre aussi que le développement du programme Apollo (ainsi que des éléments qui l’ont composés) s’est fait souvent de façon anarchique ; il suffit de voir le passage sur les instructions « extended » pour comprendre qu’ils ont dû ajouter plusieurs instructions non prévue à la base…
Dans cette vidéo on découvre que l'AGC avait déjà du mutlitache preemtifs (ce que Microsoft n'a mis en place que dans les années 1990) mais aussi des "machines virtuelles", ce qui en fait un ordinateur très moderne pour un ancêtre...